Over the past few weeks, I’ve written about why it’s important to measure the amount and direction of force that a worker uses, and why the worker’s body position matters. This week, I wanted to explore the impact of frequency and duration. “How often” and “for how long” an effort occurs have a big effect on worker fatigue and injury risk.
As Ergonomists, we measure job demands, and evaluate them based on research that tells us what workers can safely tolerate. New tools are available that will automatically digitize video images, so we can capture postural information, at least for the arms and back. These tools can document how long a body position is “held”, and how “repetitive” a movement is. As I will show below, these are important metrics, but generally are not helpful without the “force” data. These new tools, typically used in conjunction with mobile phone videos, cannot measure how much force is exerted by the worker.
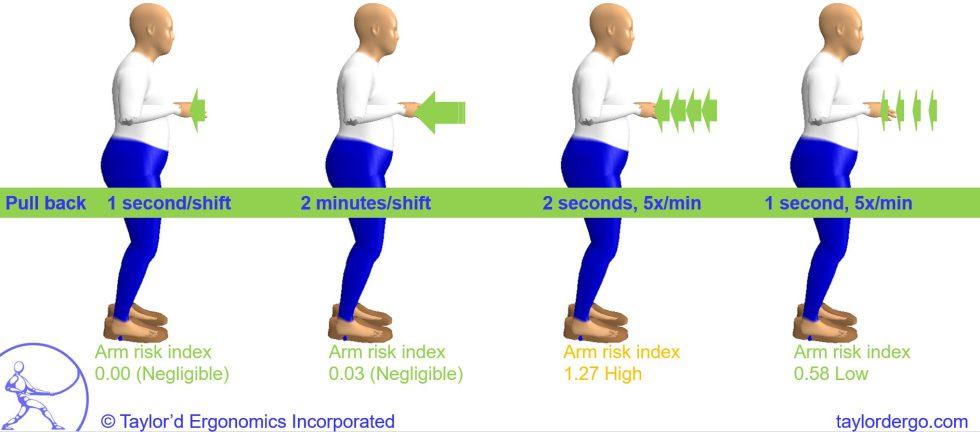
As I’ve done for my previous two articles, I’ve completed a quick assessment of the demands on the arms for one of the “20-pound pull” tasks that I started out with. The 20-lb pull force represented 38% of the worker’s arm strength in this posture. (More details about my methods are described at the bottom of this page.) From left to right:
If a worker exerts this effort for 1 second, once per day, the risk of injury would be very low. Ample time is available for the muscles to recover from the effort.
If a worker must hold this pushing effort for 2 full minutes, once per day, the risk of injury would still be very low. The worker still has enough time to recover from the effort.
If the worker must exert the effort for two seconds, 5 times per minute, all day, the risk of injury would be high. The muscles would not have time to recover from the efforts, and they would fatigue over the course of the day.
If the worker must exert the effort for only 1 second, 5 times per minute, all day, the risk of injury would be low. As you can see, the difference between one and two seconds per effort is important!
What if we “guessed” at the force instead of measured it? Maybe the worker thinks it’s pretty easy, so we estimate a force of 12 lbs instead of 20 lbs. In this body position, 12 lbs represents only 25% of the worker’s maximum strength, and, at 2 seconds per effort, the risk would be low even at 9 times per minute!
Most of the new automated tools use analysis methods in a “black box” – the user can’t see what tools are used in the calculations. We believe that many motion capture tools are applying an analysis method that has been around since 1993, called “RULA” for arm assessment. Out of curiosity, I ran the four tasks shown above through the RULA tool. The first task (once per shift for one second) scored a “3”, which represents “action level 2: further investigation is needed”. (According to the original 1993 research article.) All the rest scored “4”, which is also action level 2.
What-if assessments
Measuring force (amount and direction), position (hand heights and reach), and time parameters helps us to be confident in the advice we give. Using a model that is sensitive to force, posture, and frequency/duration also allows us to explore what happens when we change different parameters.
- If we change the position and orientation of the handle, then the worker may be able to generate more strength, and the risk would be reduced.
- If we change the design of the control so the worker doesn’t have to hold the effort for as long, then the risk is reduced.
- If we need to speed up the production rate, we can predict how risk will be increased.
- If we want to add other tasks to the work cycle, we can see how risk would change.
To affect the RULA score by changing force alone, we would have to reduce the force to less than 2 kg. The frequency threshold required to affect a score is 4 efforts per minute, and the threshold for a static exertion is 1 minute. Body position changes also affect the score. To obtain an “action level 1” (acceptable) score for this task, we would have to optimize body position (lower hands slightly, keep wrists perfectly straight), force (less than 2 kg), and frequency (less than 4 times per minute). There are other interpretations for RULA scores; some organizations advise that scores of 4-5 should be “medium risk” and 6 or more would be high risk. But you get the idea.
To complete a “what if” assessment using the video analysis tools, you have to be able to mock-up the job so you have data to analyze.
Assessing jobs using our method is time-consuming, so it isn’t worthwhile for every project. If we can use a simpler tool to get the answer we need, by all means, we do! But for some projects, this is the best way to understand what’s happening to the worker’s body, and what impact various changes will have. We’ll be happy to adopt technology that allows us to complete these types of assessments more efficiently, and in a way that is transparent to the client!
Details about my methods: These analyses were completed with University of Michigan’s 3D Static Strength Prediction Program, LaDelfa and Potvin’s Arm Force Field, and Gibson and Potvin’s Recommended Cumulative Recovery Allowance. I used a 50th percentile height and weight female mannequin, of 25th percentile strength. This means that 75% of female workers, and more than 75% of male workers, would be safe, if the job is safe for this worker. The “risk index” is a ratio of the actual demands to the recommended threshold; when the risk index is greater than 1, the worker is at a higher risk of injury. In this case, the worker’s muscles would not have enough recovery time to avoid fatigue.
RULA was originally published by McAtamney and Corlett in Applied Ergonomics, in 1993. I used an app from OHCOW to get scores for this article.